Tabula Dashboard
Real-time dashboards that turn your Simpro data into clear, actionable business insights.
Description
Tabula Dashboard is a complete business intelligence platform built specifically for trade businesses running Simpro. Connect your account in minutes and get immediate visibility into the metrics that matter most — profitability, cash flow, job performance, staff utilisation, sales pipeline health, and customer value.
Unlike generic reporting tools, every dashboard and metric is designed around how Simpro businesses actually operate. You'll see your data organised across six focused views:
Unlike generic reporting tools, every dashboard and metric is designed around how Simpro businesses actually operate. You'll see your data organised across six focused views:
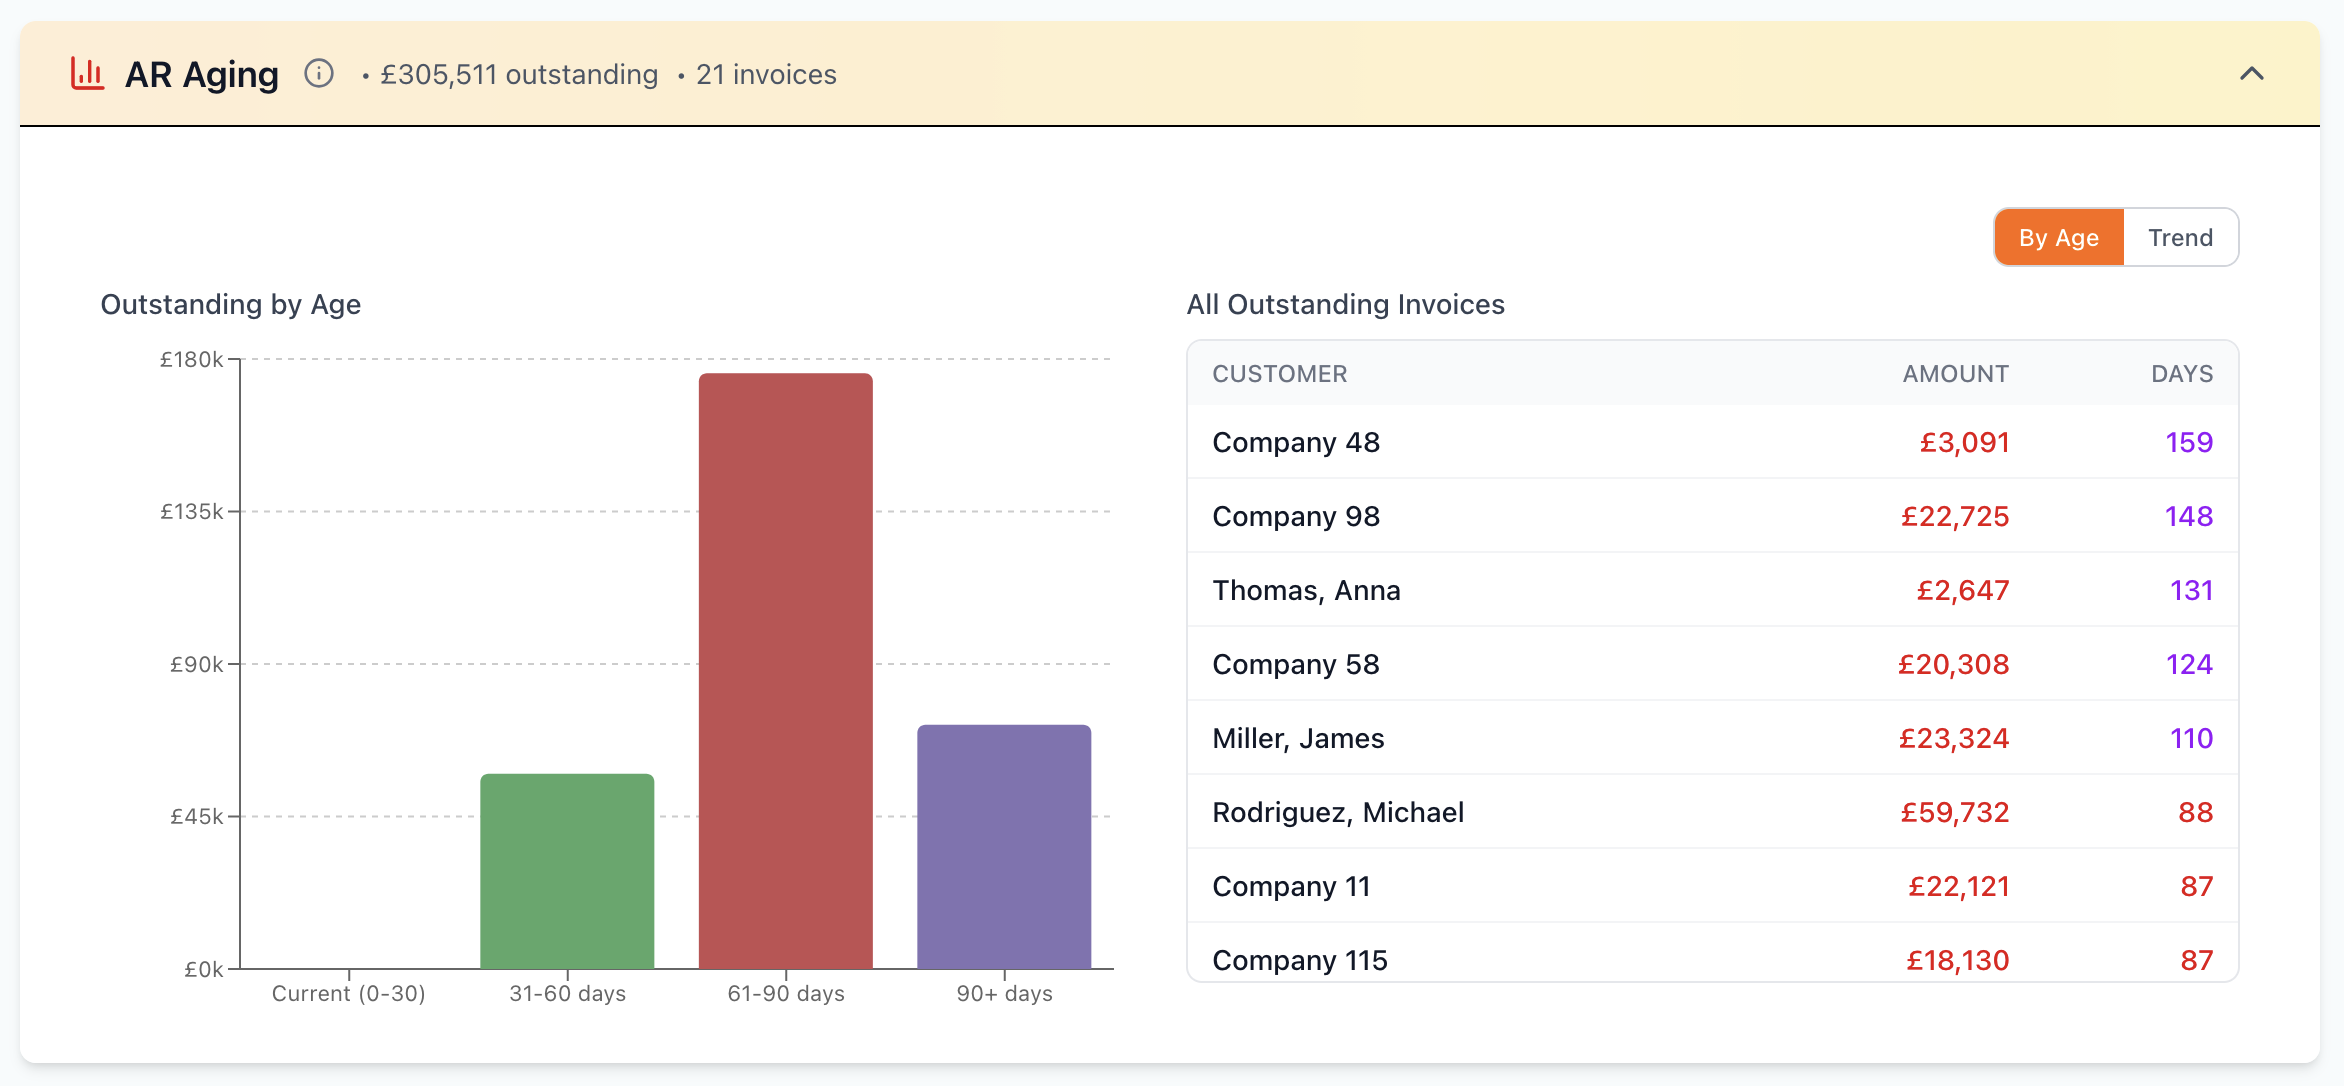
- Finance — AR aging, invoice tracking, overdue prioritisation, revenue and profit trends, and DSO at a glance
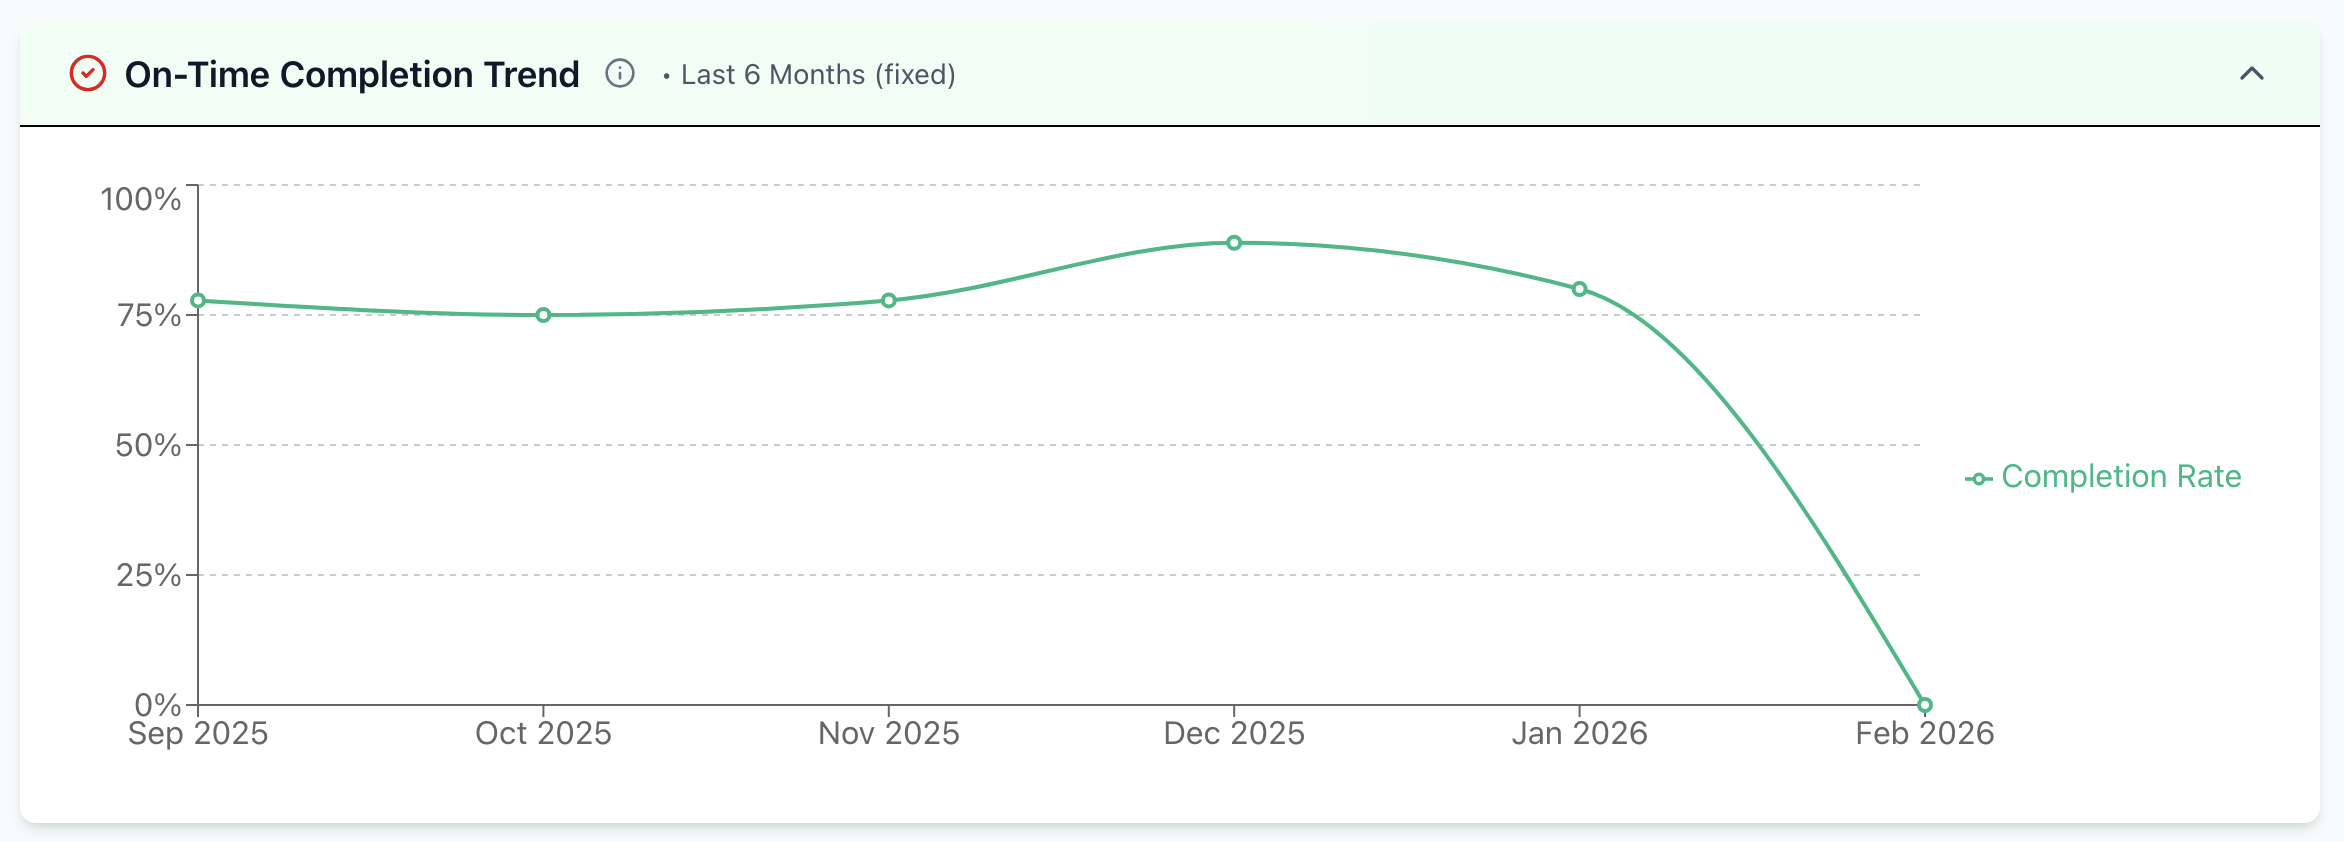
- Jobs — Spot jobs going over budget or falling behind schedule, track completion rates, and drill into individual job profitability
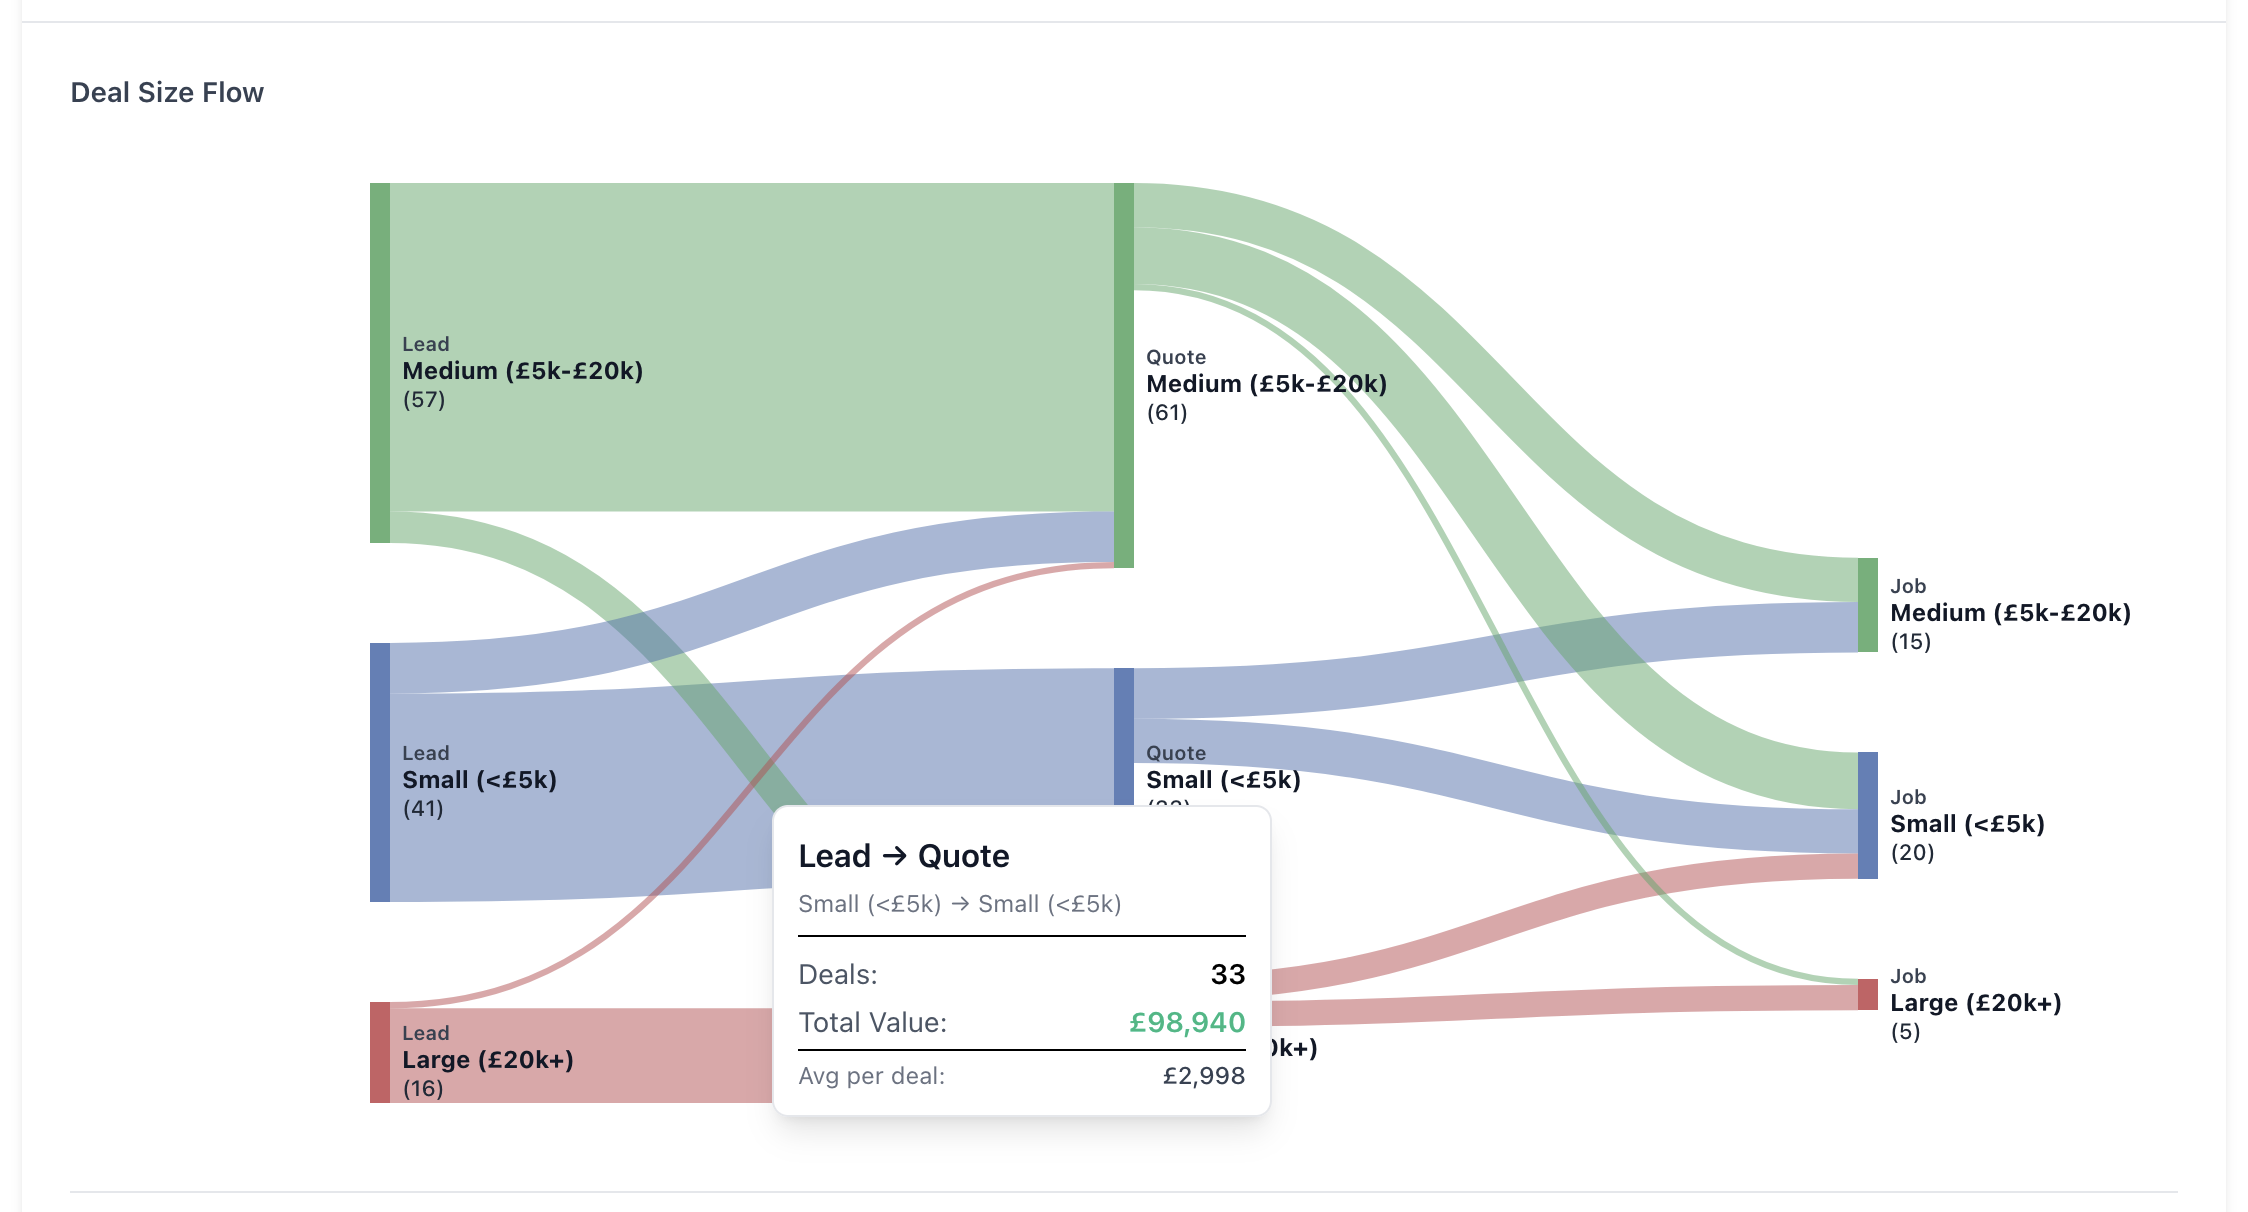
- Sales — Pipeline value by stage, quote conversion rates, stalled opportunities, and sales velocity to keep deals moving
- Staff — Technician utilisation, billable efficiency, daily schedules, and overtime alerts so you know who's where and how productive they are
- Customers — Lifetime value, top revenue accounts, churn tracking, and collection priority to focus on the relationships that matter
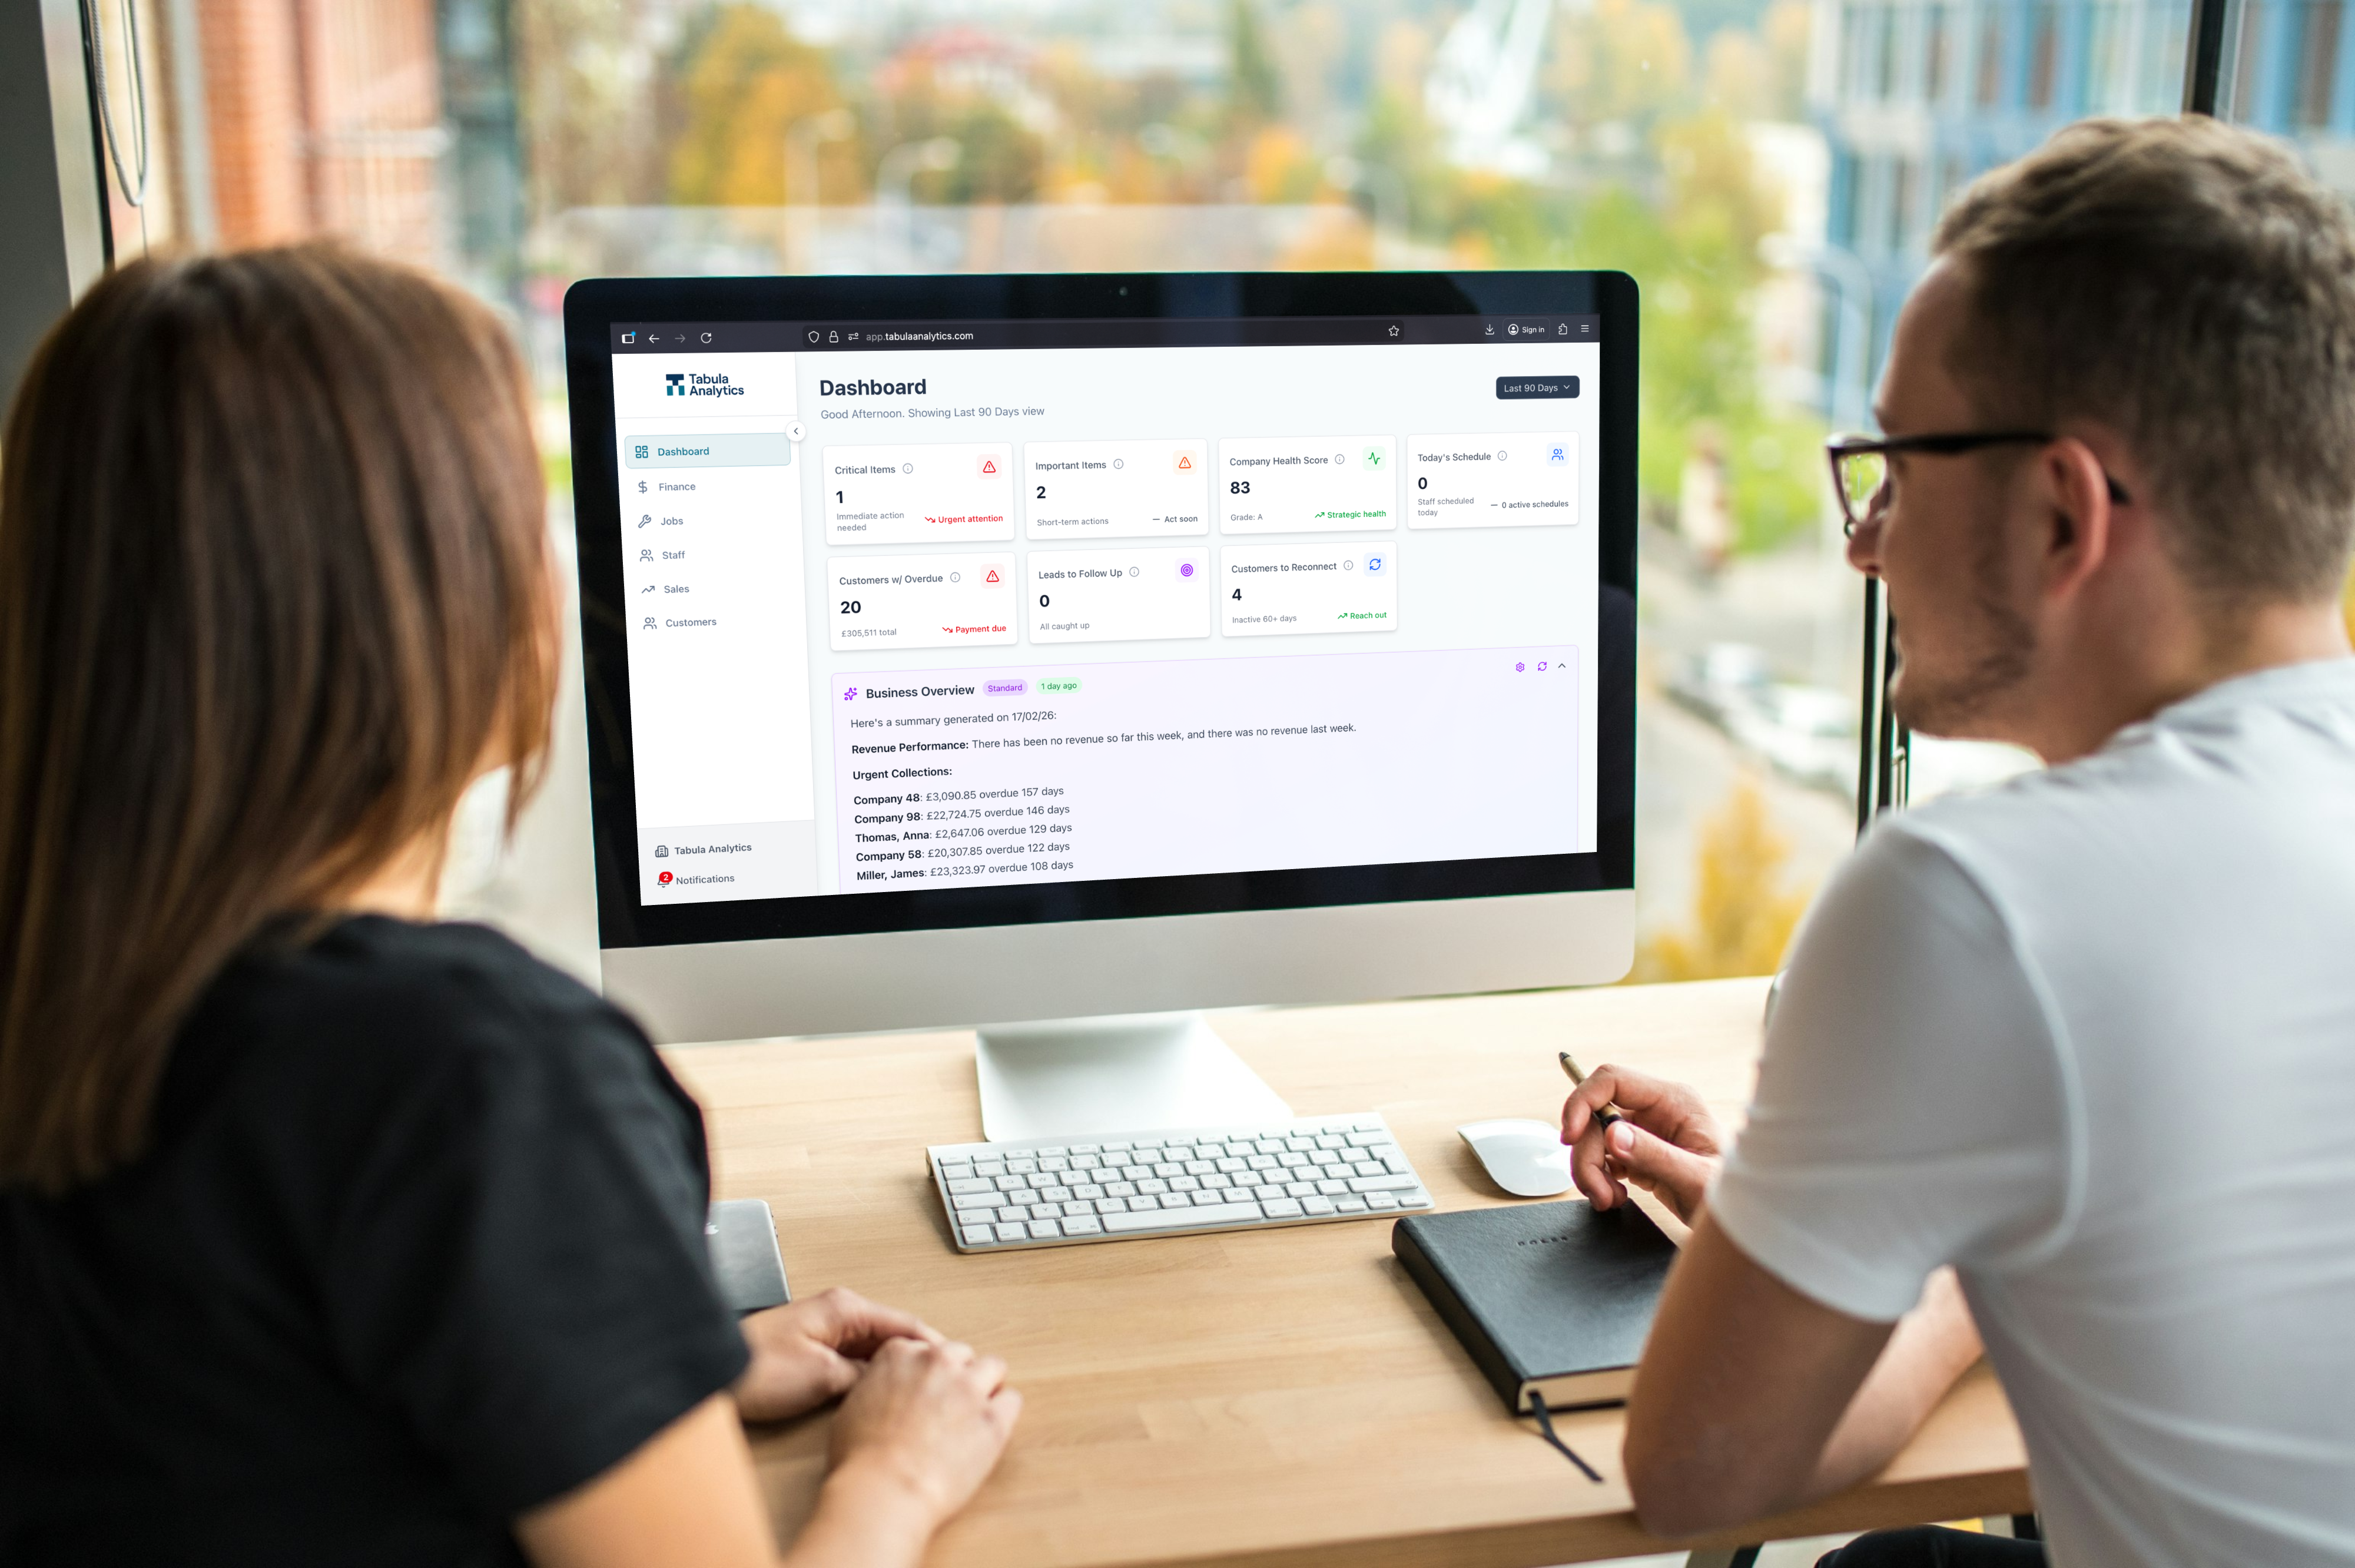
- Overview — A Priority Actions grid that surfaces the most critical items across your business so you know exactly where to focus today
Customise your view with flexible time range filtering — last 7 days, month-to-date, quarter, year, or all time — and drill from high-level trends down to individual records.
Need to go deeper? With Pro licenses a built-in assistant lets you ask questions about your data in plain language and get instant answers. AI-generated summaries on each page highlight what's changed, what's improving, and what needs your attention — so you spend less time analysing and more time acting.
No Power BI licenses. No spreadsheets. No consultants. Just connect your Simpro account via OAuth (read-only — your data is never modified) and start getting insights straight away.
Features
Finance & Cash Flow
Track AR aging, days sales outstanding, revenue trends, and profit margins. Manage invoices with sorting, filtering, and CSV export. Generate professional collection emails for overdue accounts in one click.
Job Performance & Costing
Monitor budget vs actual costs across your jobs, spot overruns early, and track completion rates and cycle times. Drill into any job to see the full picture — costs, staff, invoiced amounts, and timeline.
Sales Pipeline
Visualise your pipeline by stage, track win rates over time, and identify hot leads and stalled opportunities. Understand your sales velocity and where deals are getting stuck.
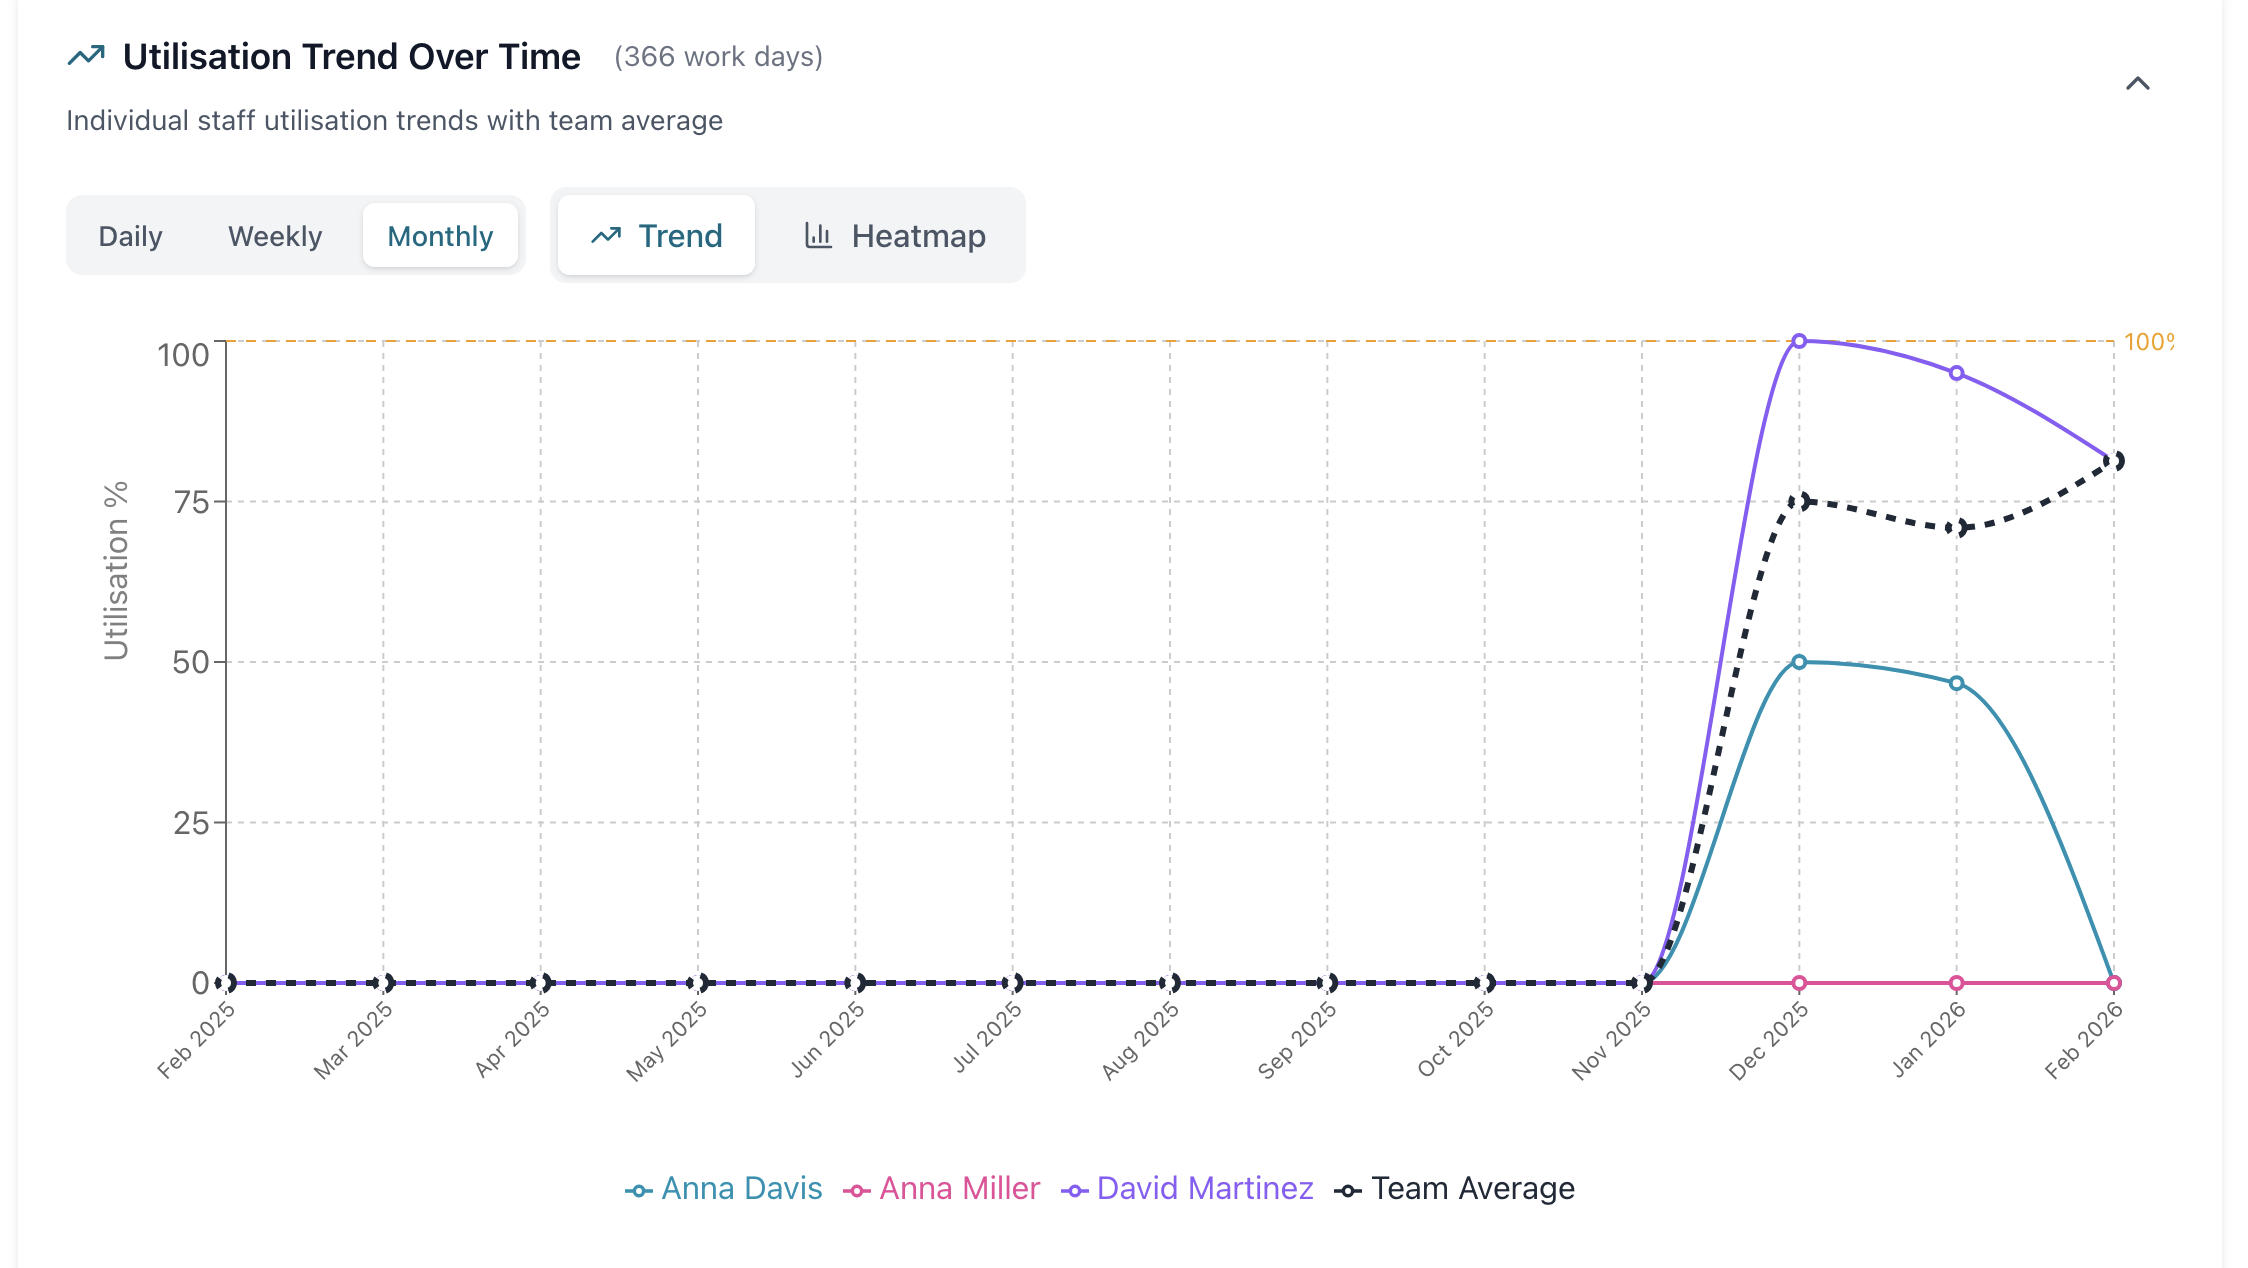
Staff Utilisation
See who's working, where, and how productively. Track billable vs non-billable hours, spot overtime, and view daily schedules — all pulled directly from your Simpro timesheets.
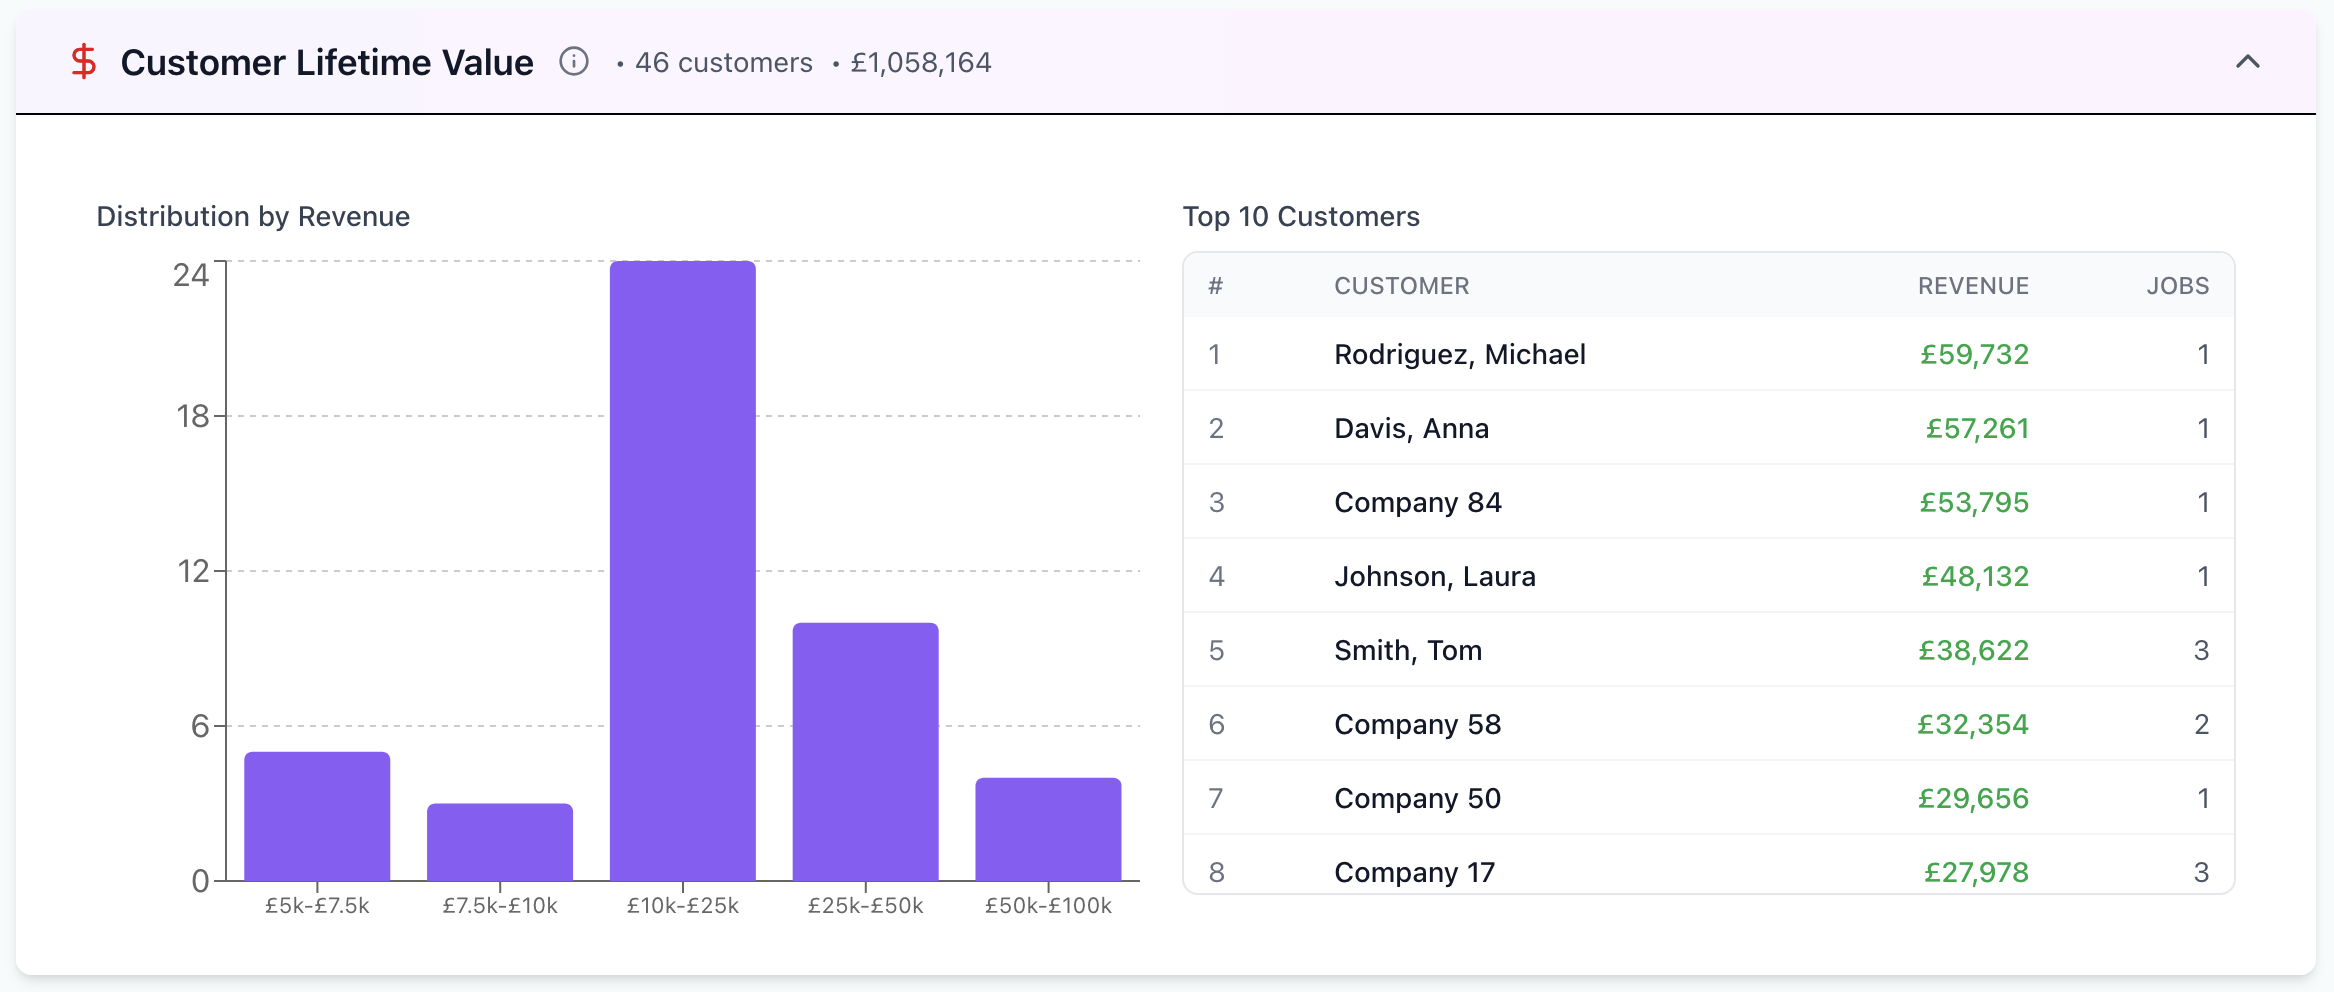
Customer Insights
Understand which customers drive the most value with lifetime value calculations, acquisition trends, and churn tracking. Prioritise collection efforts based on outstanding amounts and payment history.
Media
Reviews
Pricing
Essential
£169/ $219/ A$339 per month
For trades businesses that want instant visibility into their Simpro data. Up to 10 users. One-time £299/ $379/ A$599 onboarding fee applies.
- Real-time Simpro data sync
- 40+ business KPIs and metrics
- Company Health Score with A-D grading
- AR aging, DSO tracking, and invoice management
- Job costing with budget vs actual variance
- Sales pipeline and quote win rate tracking
- Staff schedule Gantt chart and utilisation
- Customer lifetime value and churn analysis
- Priority alerts for critical business events
Pro
£249/ $319/ A$499 per month
Unlock AI-powered insights to make smarter decisions, faster. Everything in Essential plus AI chat and daily summaries. Up to 10 users. One-time £299/ $379/ A$599 onboarding fee applies.
- Everything in Essential
- Tabula AI Assistant — chat with your Simpro data in plain English
- Automated AI daily summaries for each dashboard page
- AI-generated collection emails with tone selection
- Context-aware AI that adapts to the page you're viewing
Enterprise
For companies with 50+ employees in Simpro. Unlimited users, priority support, and dedicated onboarding. Everything in Pro included.
- Everything in Pro
- Unlimited dashboard users
- Priority email support
- Dedicated onboarding with data quality review
- Companies with 50+ employees in Simpro
* The pricing here is for display purposes only. You should contact the partner for the most up to date and correct pricing information. We do not take any responsibility for this pricing information, which is provided by our partners. Pricing last updated: 03 Mar, 2026 12:00AM
FAQ
Tabula Dashboard connects directly to your Simpro account using OAuth — the same secure authentication method used by other Simpro marketplace integrations. Just click "Login with Simpro", authorise access, and you're connected. No API keys to manage, no IT involvement needed.
Minutes. Once you authorise your Simpro account, your dashboards are populated with live data straight away. There's nothing to install, configure, or build — it works out of the box.
Yes. Tabula Dashboard uses read-only access — we never create, modify, or delete anything in your Simpro account. Your data is accessed in real time over a secure connection and is not stored or exported.
No. Tabula Dashboard runs entirely in your web browser. There are no additional software licenses, plugins, or downloads required.
Yes. A global time range filter lets you switch between last 7 days, last 30 days, last 90 days, month-to-date, quarter-to-date, year-to-date, or all time. This applies across all dashboards so you can focus on the period that matters to you.
Tabula Dashboard covers six key areas: Finance (revenue, profit, AR aging, invoices, DSO, cash flow), Jobs (status, costing, at-risk jobs, completion rates), Sales (pipeline, win rate, stalled quotes, sales velocity), Staff (utilisation, billable efficiency, schedules, overtime), Customers (lifetime value, churn, acquisition, collection priority), and an Overview with a Priority Actions grid and business health score.
No. If you can use Simpro, you can use Tabula Dashboard. Everything is designed to be intuitive and self-explanatory. There's also a built-in help section and an AI assistant you can ask questions in plain English if you want to dig deeper into your data.
Tabula Dashboard connects to your Simpro data in real time — not overnight batch syncs. Data is refreshed with a short cache to ensure fast load times while keeping everything current throughout the day.