Description
What is Dashboards Pro?
Dashboards Pro is a complete, ready-to-use solution built specifically for trade business owners who want to grow their business through data-informed decisions. Unlike generic reporting tools, it helps you unlock more value from the systems you already use by transforming data into clear and actionable insights, with no need for manual analysis, spreadsheets, or guesswork.
Built on years of experience in the trade sector, Dashboards by API goes far beyond basic reporting. We deliver complex, well-defined metrics that reveal deep insights into job profitability, callback costs, team performance, operational efficiency, and more, delivering insights you simply won’t find anywhere else, that will truly move the needle in your business.
Our dashboards require no training or technical expertise and are designed to work straight out of the box. With accurate, timely, and business-relevant insights, your team gains access to the same consistent data, driving efficiency, and empowering smarter decision-making across the board.
Dashboard by API unlocks the data in your business enabling you to make data-informed decisions that improve performance and drive profitability.
The 8 Essential Reports
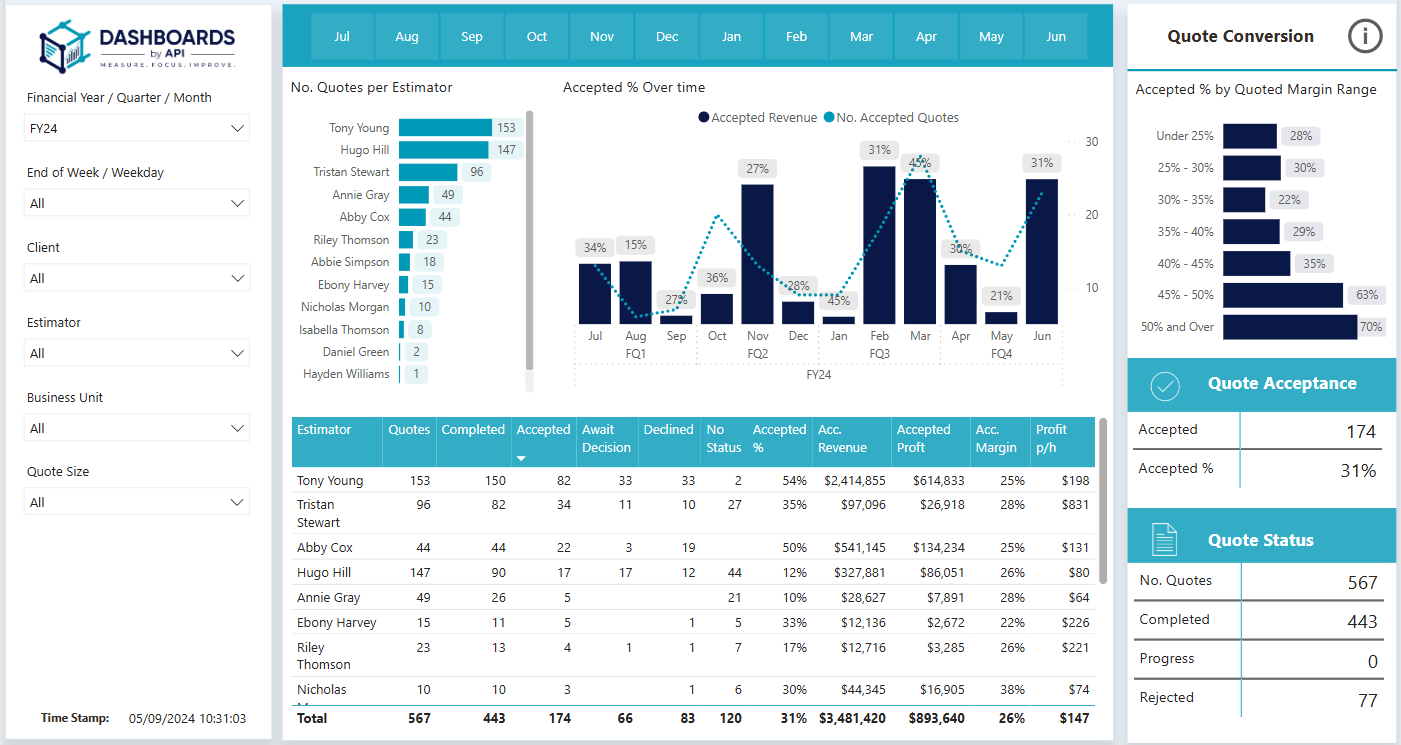
- Quote Conversion
Tracks how often quotes are accepted over time, grouped by estimator and revenue range. This helps you see who's closing the most deals and if your pricing is right, so you can improve your win rates and plan better. - Revenue Matrix
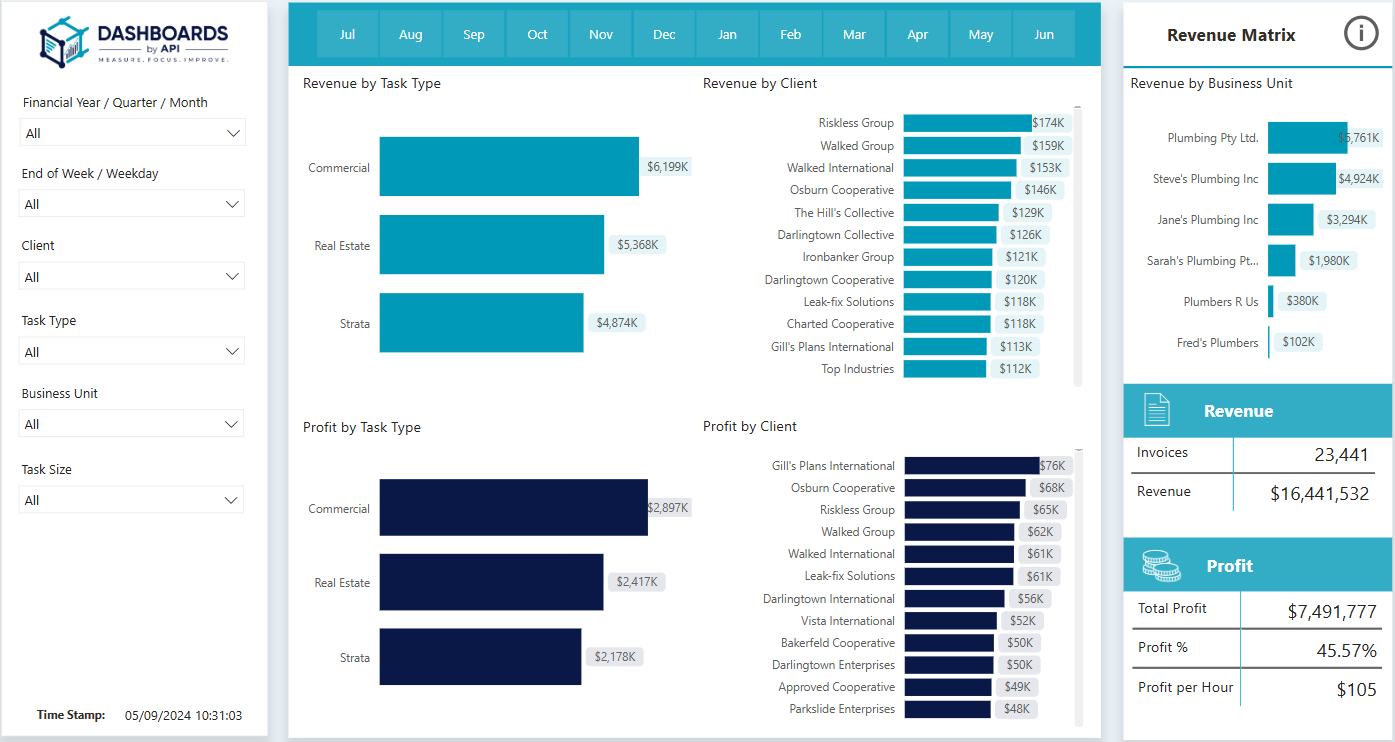
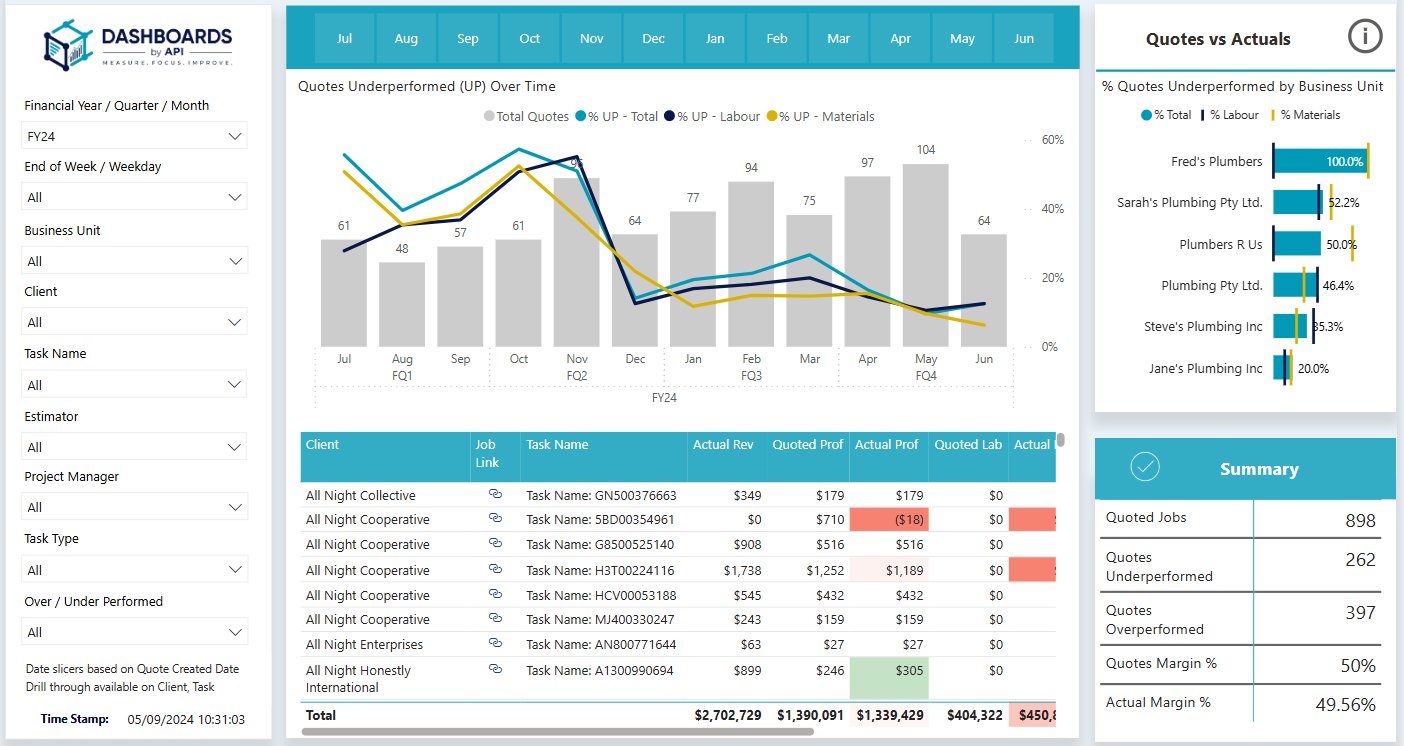
Shows revenue by task type, client, and business unit, giving a clear picture of where your income is coming from. This helps you focus on your most profitable services, clients, and areas for growth. - Quote vs. Actual
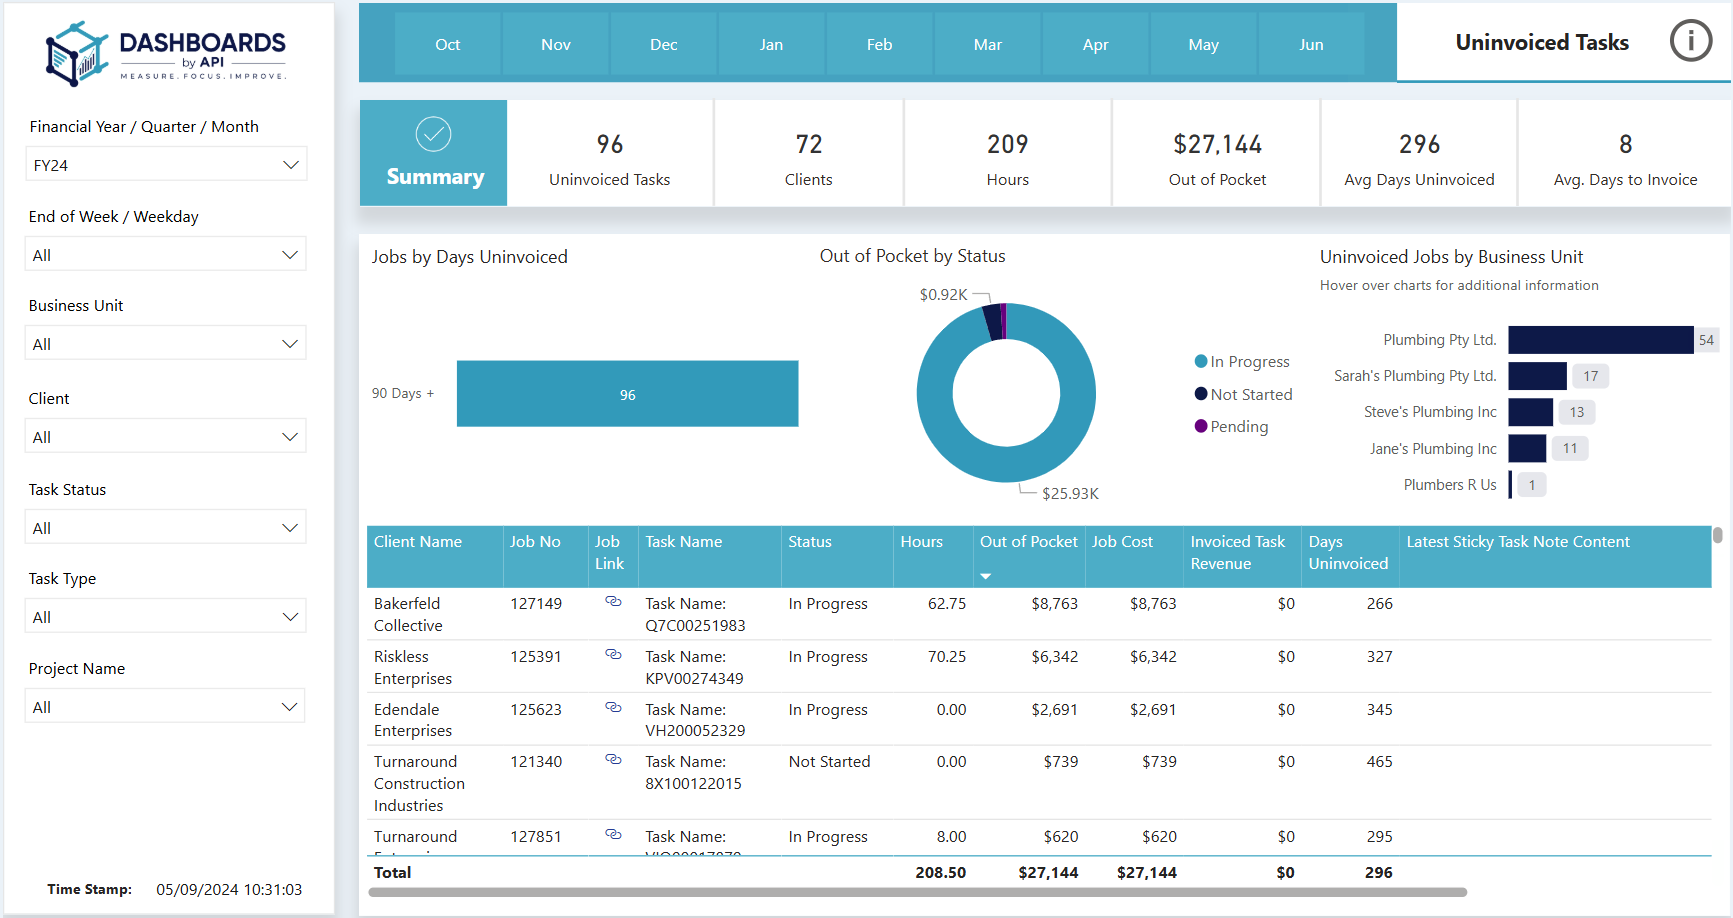
Compares quoted job costs to actual costs and profit for fully invoiced jobs. This makes sure you’re invoicing correctly and helps you fine-tune future quotes to keep your jobs profitable. - Uninvoiced Tasks
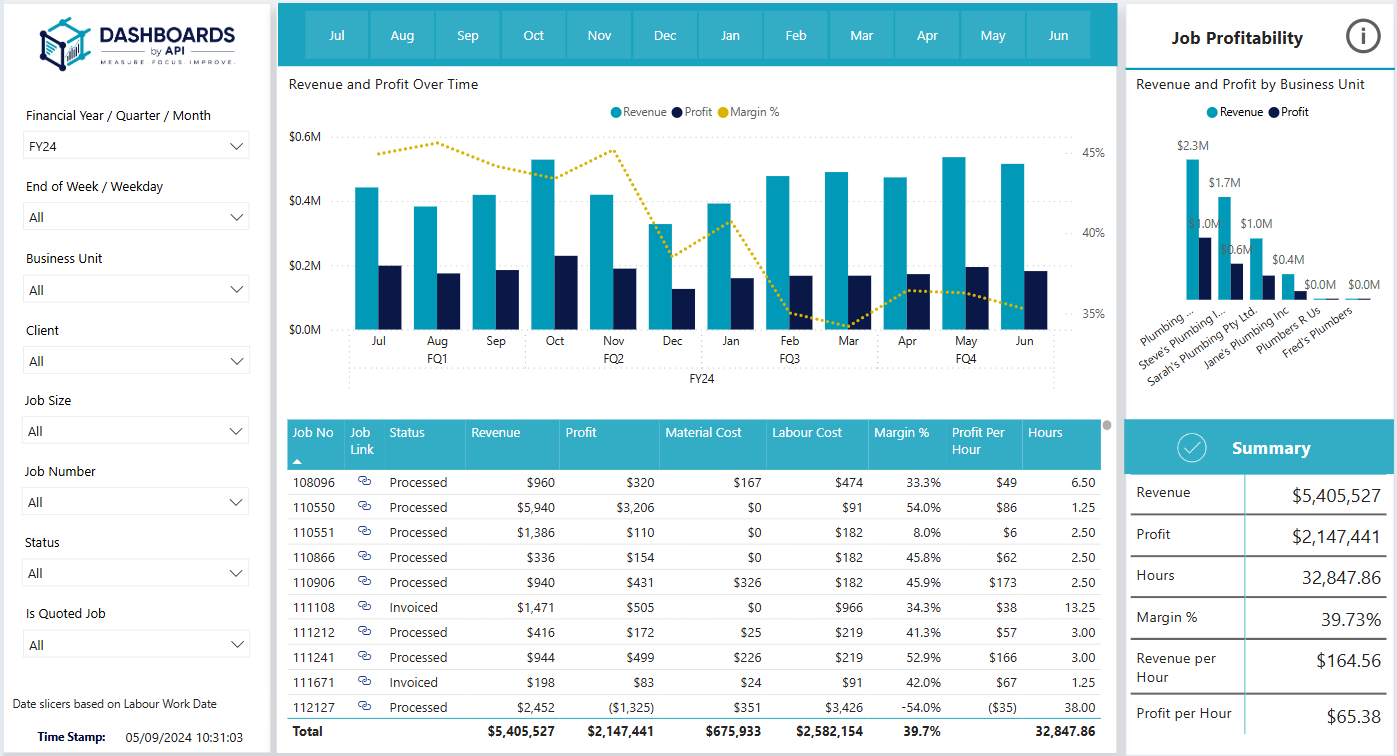
Highlights jobs that are done but not invoiced, broken down by status and time. Helps you stay on top of invoicing to improve cash flow. - Job Profitability
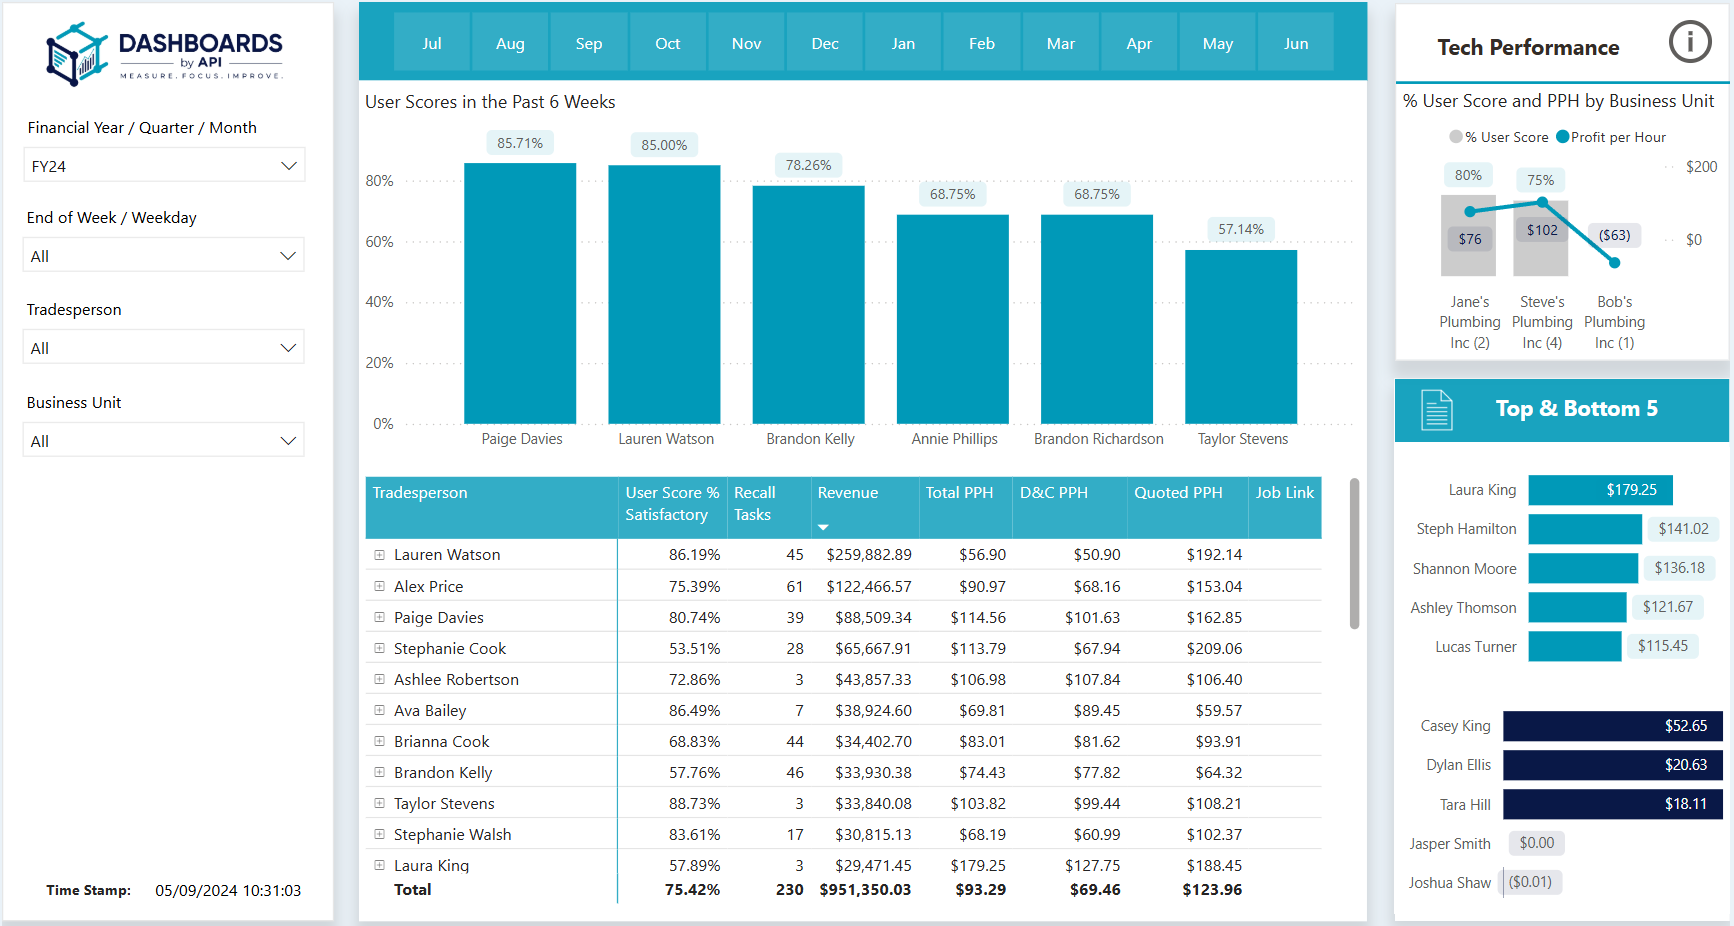
Tracks how profitable your fully invoiced Do & Charge jobs are, making sure you're invoicing accurately and covering your costs. This helps you keep projects profitable and adjust pricing or management as needed. - Technician Performance
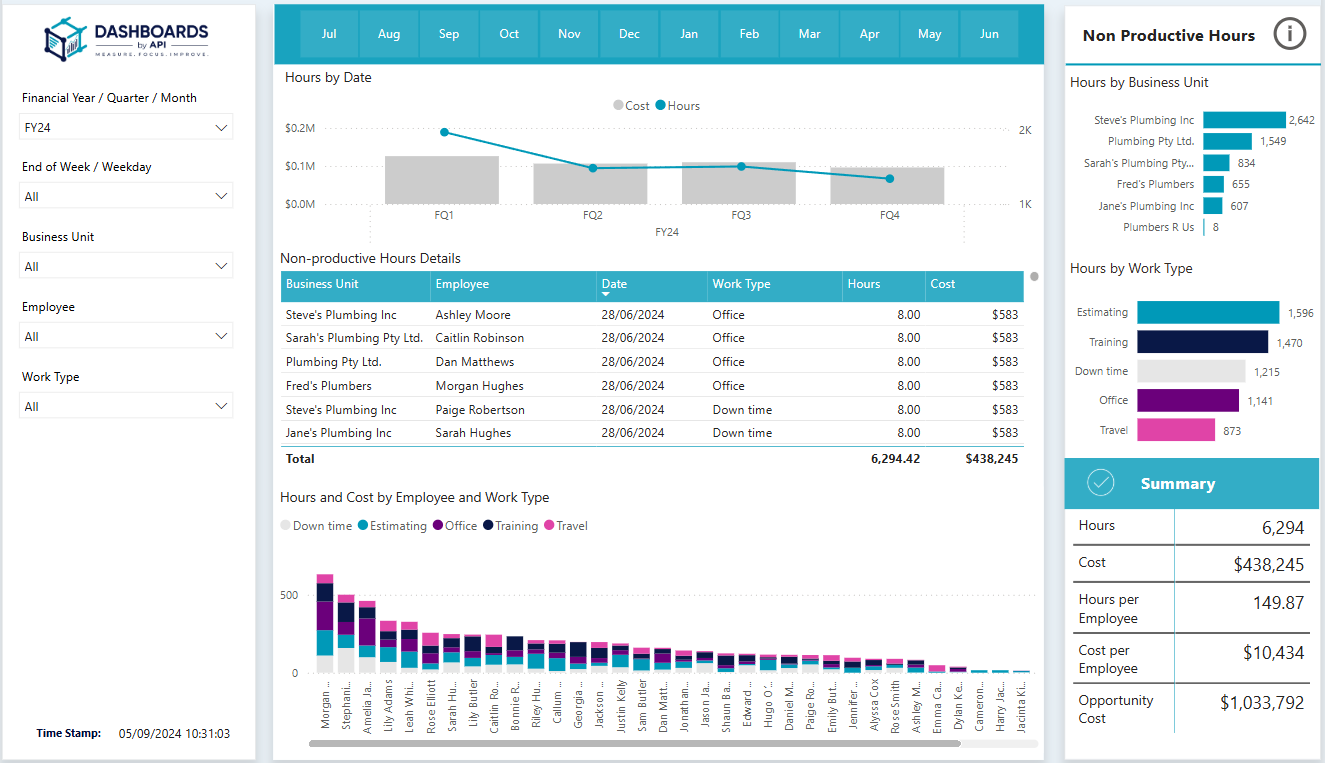
Ranks workers based on a custom KPI and their Profit-Per-Hour, helping you spot top performers and areas for improvement. - Non-productive Hours
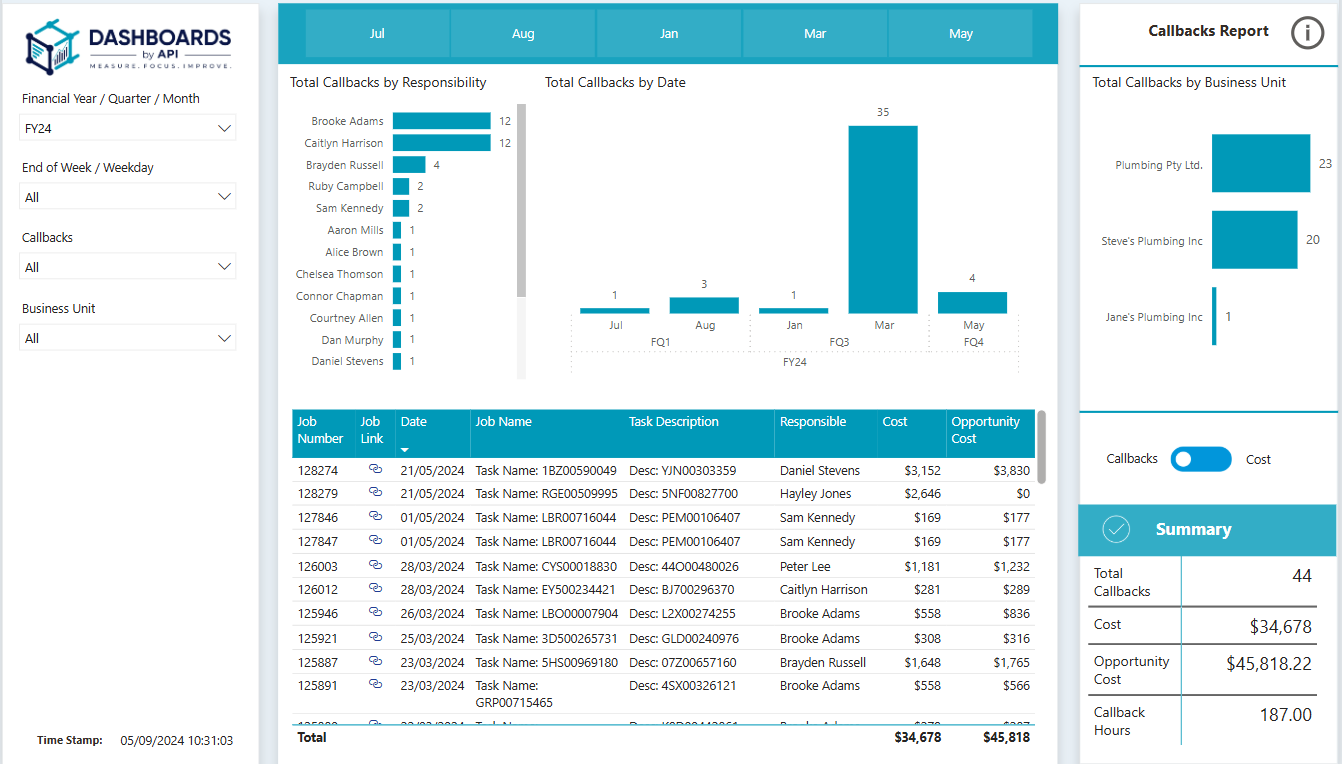
Displays non-productive worker hours and their cost. Helps you reduce wasted time and labor, improving efficiency. - Callbacks
Identifies workers with more callback jobs and calculates the true cost of these issues. This helps you spot performance problems and reduce rework, saving money and keeping customers happy.
Data Refresh Frequency Data is refreshed overnight for daily insights.
Features
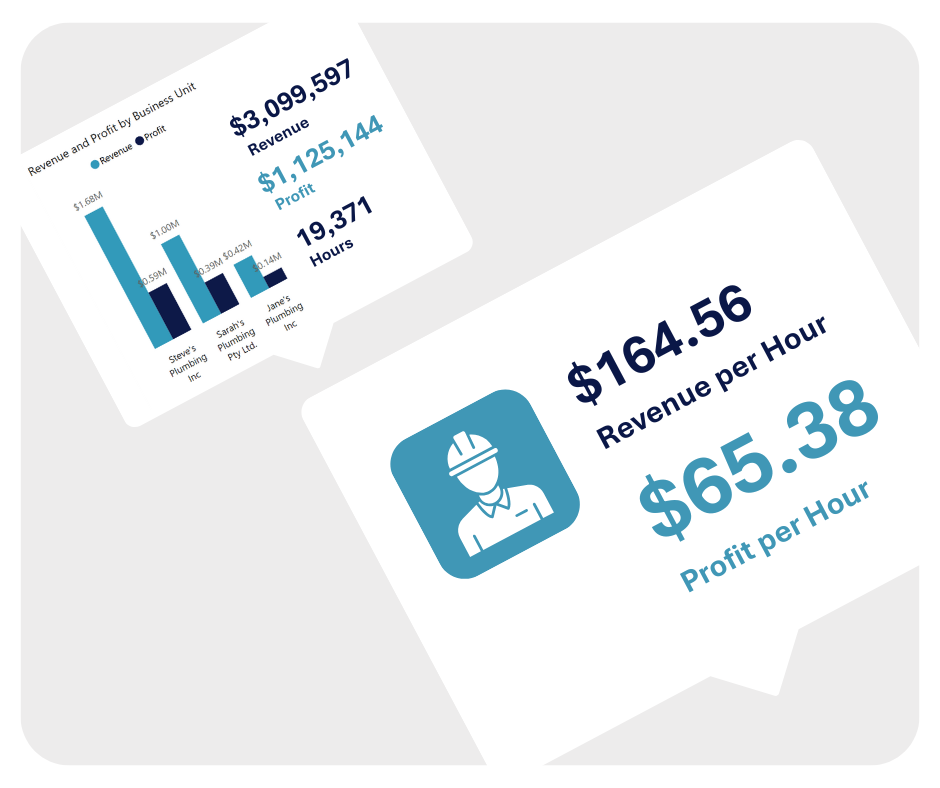
Profit per hour
Make every hour count. Understand exactly how much profit each hour of work generates, allowing you to optimise processes and maximise your earnings.
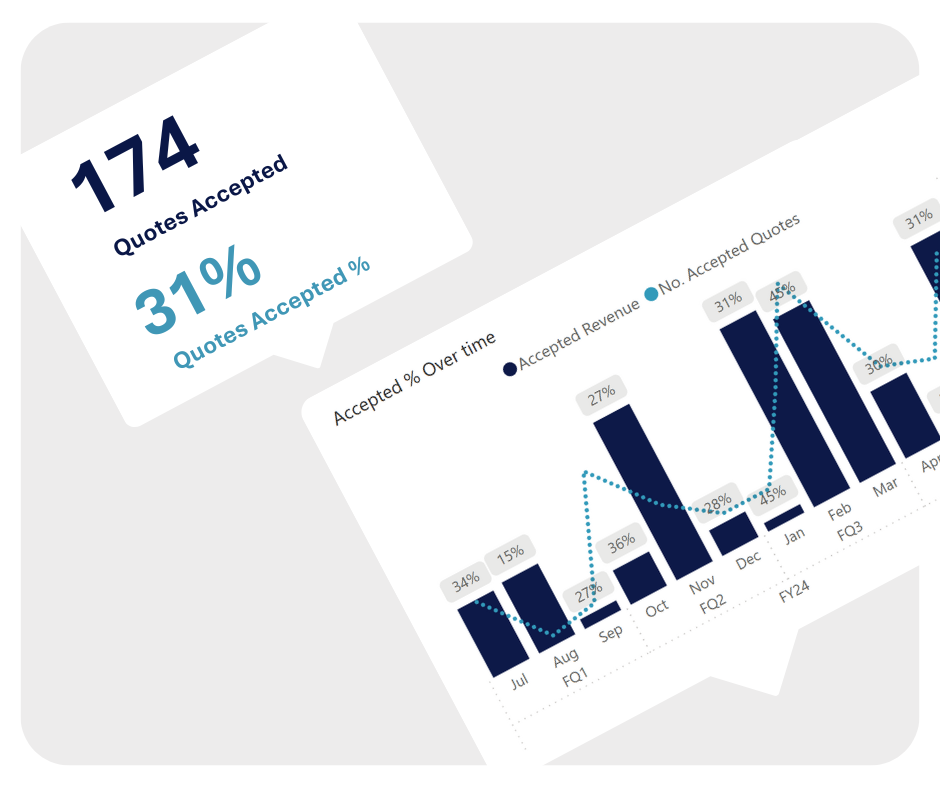
Quote Conversion
Understand Who's Converting Quotes and Which Ones Are Most Profitable to Refine Your Approach and Increase Success.
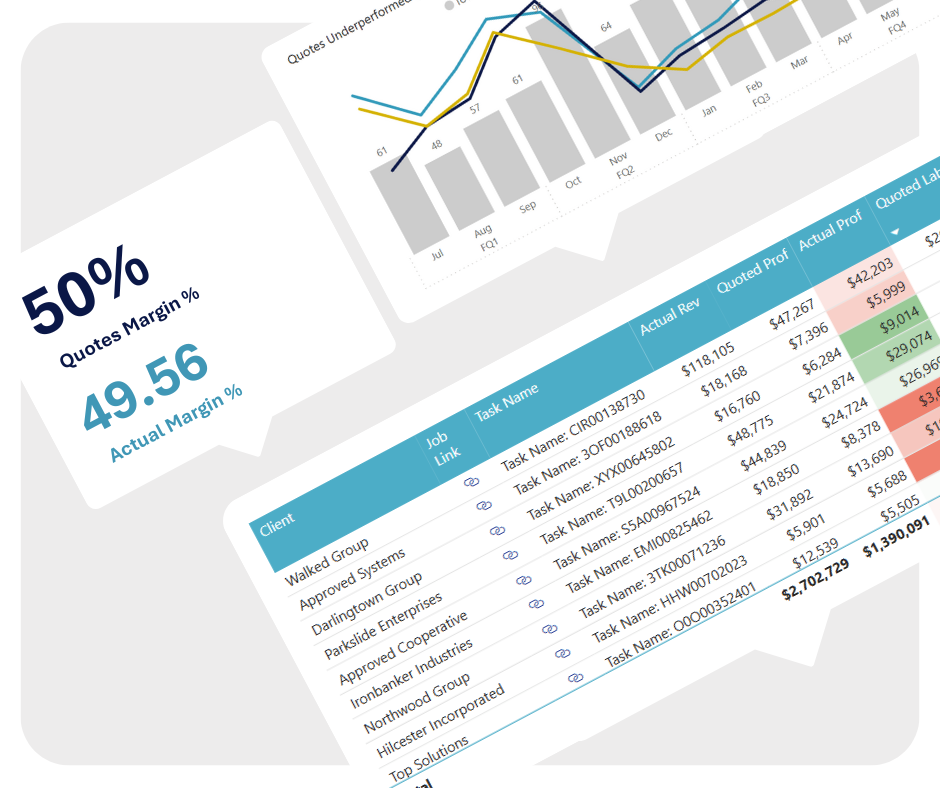
Quote vs Actual
Unlock the Power of Quote vs Actual Analysis. Pinpoint Issues with Estimating or Execution to Make Data-Driven Decisions and Boost Your Bottom Line.
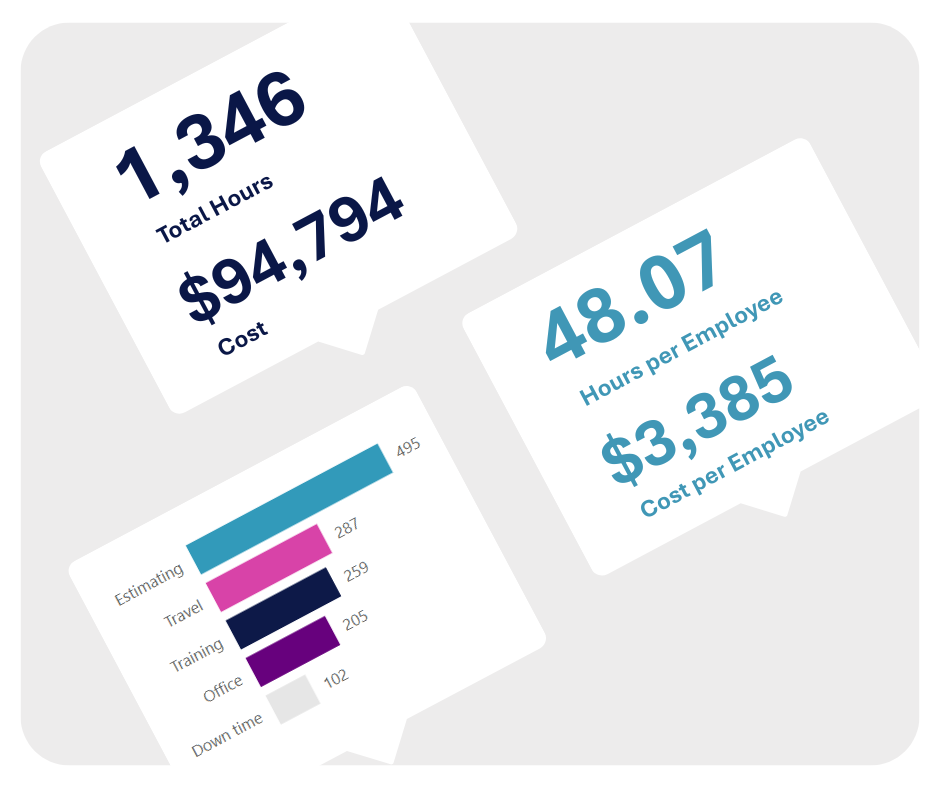
Non-productive hours
Clearly Identify Non-Productive Hours and Understand Where Time Isn't Earning You Money.
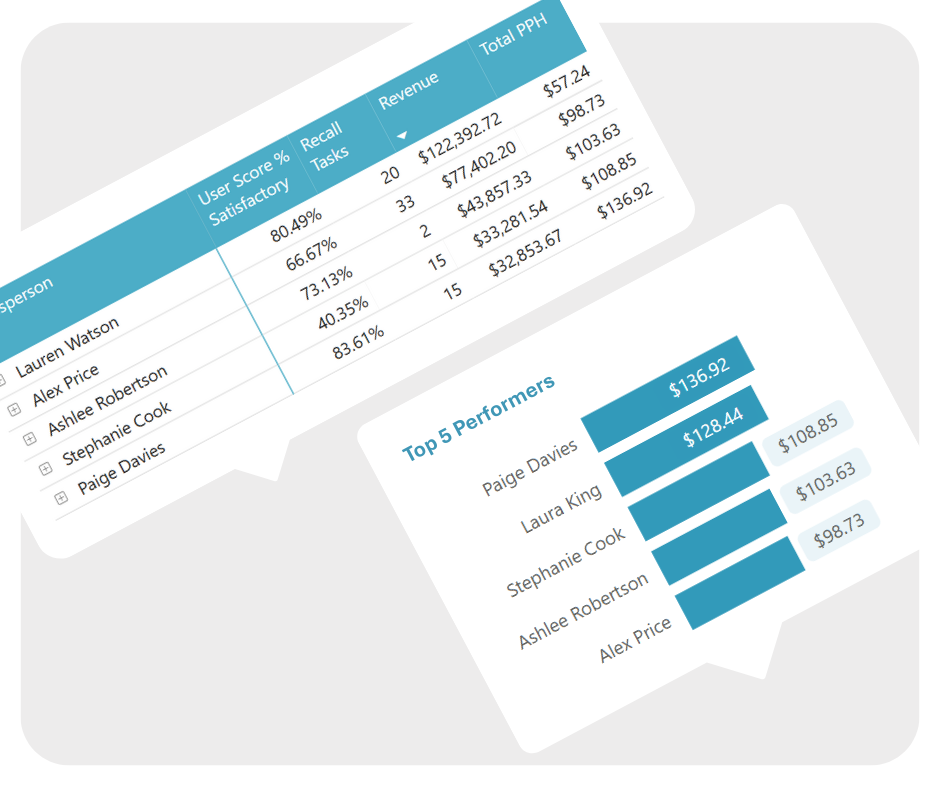
Inspire your Team
Fair, transparent, and data-backed. Let the data speak for itself when it comes to technician performance—use it to reward effort, back up pay decisions, and motivate your team.
Media

Reviews
Resources
FAQ
Yes, your data can be refreshed more frequently. Get in touch with our sales team to tailor a refresh schedule that suits your business needs.
Yes, you can choose to keep specific dashboards access separate within your team. This requires an additional Power BI license. Contact us to discuss your access needs.
Once we’ve confirmed your reports and access, your dashboards will typically be ready within 7–10 business days.
Dashboards by API is built around best-practice usage of Simpro. In most cases, it will work seamlessly with how you're already using the system. However, to ensure all reports deliver accurate insights, some small setup adjustments may be required. You can find step-by-step setup instructions in our Resources section.
Yes. Our Dashboard Pro package includes a set of 8 essential reports, and you can choose any combination—start with a few or go all in.
Once your setup is complete, you'll receive a secure Power BI link. You can access the dashboards from any device using a single login.